The double top trading strategy in forex is a technical analysis tool for predicting when a price might stop going up and start going down. It is a technical analysis pattern that can be used to identify potential reversals in the forex market. It happens when the price reaches a high point two times but can’t go higher. This suggests that the uptrend is losing momentum and is about to reverse.
It is a popular price action trading strategy that tells traders that a change in direction could be coming, and they can use this strategy to make smarter trading decisions and maximizing profits.
Contents
What a Double Top Mean in Forex and How It Works
To understand the double top pattern forex strategy better, it is important for you to understand how currency prices move.
A currency pair can move in three ways. It can move upwards, downwards, or sideways. When a currency pair moves upwards, it means that there are more buyers than sellers. When it moves downwards, it means that there are more sellers than buyers. But when it moves sideways, it means that there is a battle, confusion, or indecision between buyers and sellers.
A double top pattern happens when a currency pair is moving upwards. As it moves upwards, the financial asset can find a resistance. A resistance is a ceiling where the asset struggles to pass or move over. After hitting the resistance, the pair might move downwards as more sellers come in. As the price drops, more buyers might come in and push the price towards the previous resistance level. When this happens, the price is usually said to have formed a double top. The following figure shows how to see a double top in forex.
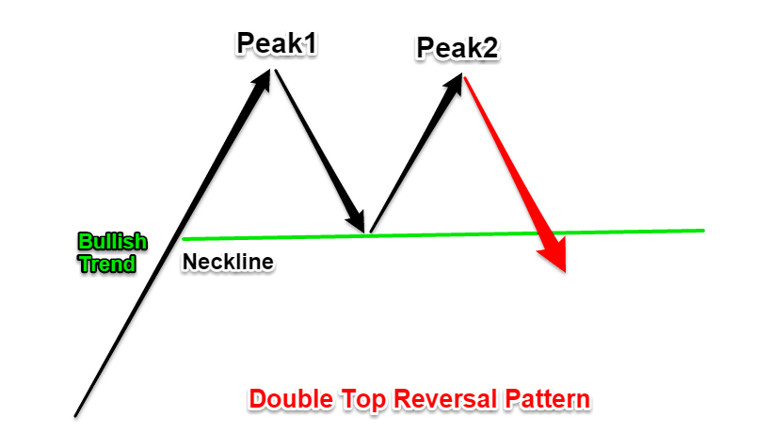
Double Top Price Action
The price action of a double top pattern typically consists of two peaks that are close together in price. The second peak should be slightly higher than the first peak, but it should not break through the previous high. Once the price falls below the neckline of the pattern, the double top pattern is confirmed.
Double top price action is all about how prices move on a chart to create the double top pattern. Once the price breaks below the dip, the pattern is confirmed, suggesting a potential reversal. Traders watch double top price action to decide if it’s a good time to sell.
How to Trade a Double Top
To trade a double top, first, spot the pattern where the price goes up twice but can’t break above the highest point. Then, put in an order to sell when the price drops below the lowest point between the two highs – that’s called the neckline.
For safety, set a “stop-loss” order above the highest high of the pattern. This helps prevent big losses if the price keeps going up. You could also use a “trailing stop-loss” that adjusts as the price goes down, locking in your gains.
Steps of Using the Double Top Trading Strategy
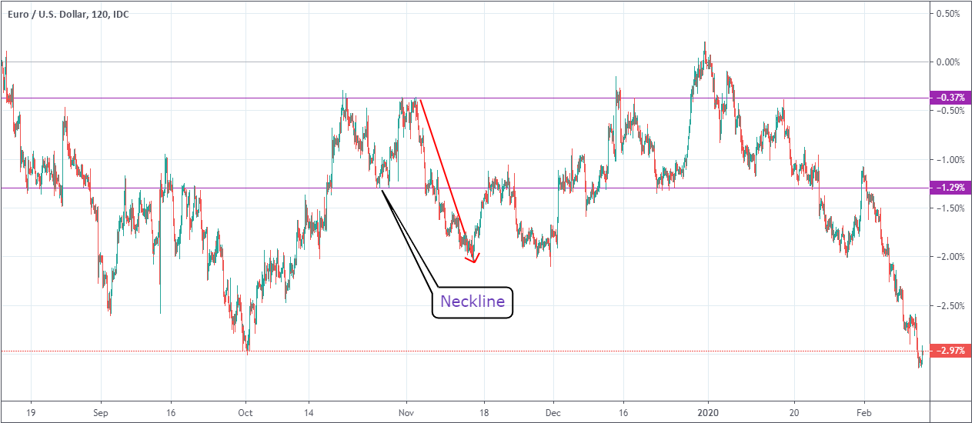
When trading a double top pattern, start by recognizing the two high points that don’t surpass the previous peak. Place a sell order below the neckline, which is the lowest point between the highs. Set a stop-loss above the highest high to limit losses if the price rises. Monitor the trade and exit if the price goes above the stop-loss. Take profits if the price reaches your target. Remember, double tops don’t always mean a price drop; sometimes it breaks through the neckline and goes higher, requiring a potential exit at a loss.
A good example of the neckline in use is shown on the EUR/USD chart below.
Another Way of Using Double Top Strategy
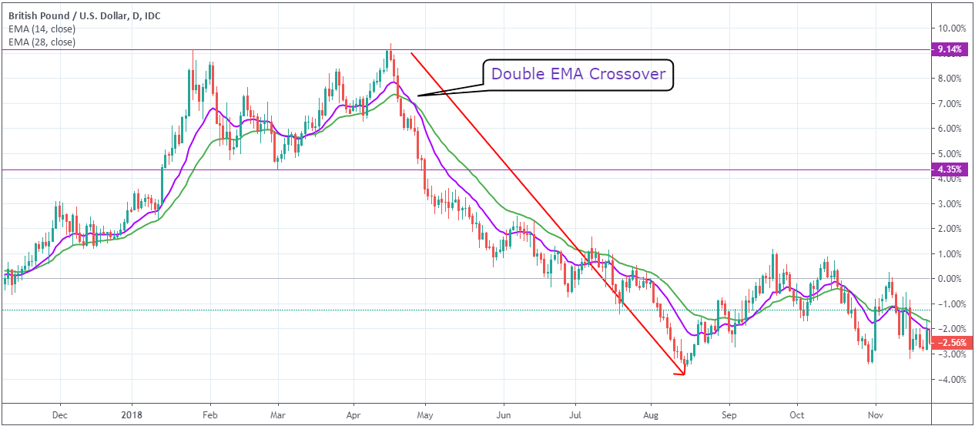
There is another way you can use the double top strategy. This is when you use it in combination with other trading indicators. Using trading indicators help you to reduce the likelihood of a false breakout. An approach I use a lot is to combine the double top strategy with a double exponential moving average (EMA). A double EMA is when you use a short and longer-term moving average. You then look for a bearish breakout. An example of this is shown on the chart below.
Double Top Examples
Let’s say you’re looking at a price chart for a currency pair like EUR/USD. Over a period of time, the price steadily climbs, forming a noticeable uptrend. At two different points in time, the price reaches a similar high level of, let’s say, 1.2000. However, both times it fails to break above this level and instead starts to decline.
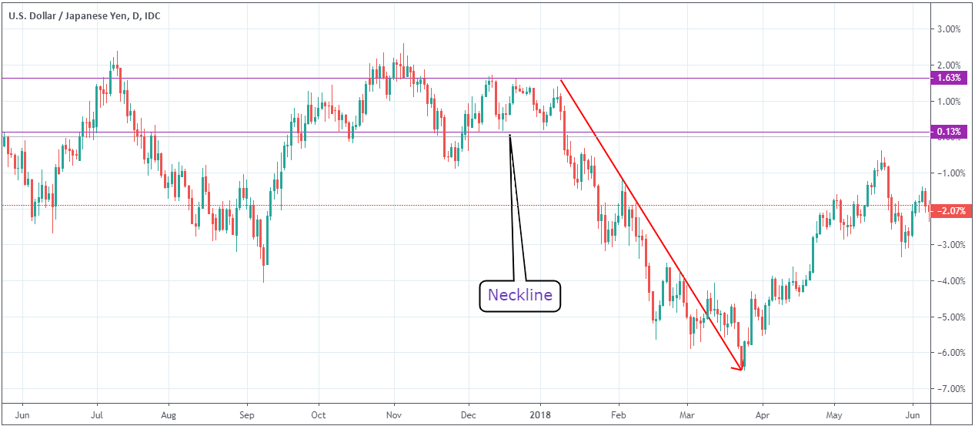
In 2018, the USD/CAD currency pair exhibited a double top pattern. Around January and March of that year, the exchange rate reached approximately 1.2900 twice but failed to surpass this level on both occasions. After the second peak, the pair experienced a notable downward movement, suggesting a potential reversal.
In 2020, the USD/JPY currency pair displayed a double top pattern. Around March and June of that year, the exchange rate approached the 111.70 level twice, but was unable to break above it. Following the second peak, the pair underwent a significant decline.
Double Top vs Triple Top
Triple top is a trading strategy that is very similar to a double top. The concept is exactly the same. The only difference is that the pair finds three resistance levels. In this case, a pair can drop again and get to the neckline, rise again towards the resistance level, and then drop again. The chart below shows an example of the triple top pattern.
Double Top vs Double Bottom
As mentioned above, the double top pattern is used to find a reversal when a financial asset is moving upwards. For this reason, it is known as a bearish reversal pattern. The opposite is also true. A double bottom is a bullish reversal pattern. It happens when the price of an asset reaches a low point twice, but fails to break through the previous low. It then moves upwards again. The chart below shows an example of the double bottom pattern.
Double Top in Forex: A Reliable Reversal Signal?
The double top trading strategy is one of the simplest price action approaches to trading. It is popular because of how accurate it tends to be and how easy it is to use it. The double top trading strategy is a way to predict potential trend reversals in forex using technical analysis. This pattern forms when an asset’s price reaches a high point twice, but can’t break through the previous high. This indicates the uptrend might slow down and reverse.
To trade a double top, first, spot the pattern and put in a sell order below the “neckline,” the lowest point between the two peaks. When the price falls below the neckline, the pattern is confirmed, and you can enter your sell order. For safety, place a stop-loss order above the higher high of the pattern to prevent losses if the price doesn’t reverse. You can also use a trailing stop-loss to lock in profits as the price moves favorably.
Remember, double tops don’t always mean reversals. Sometimes the price breaks through the neckline and continues to rise. If this occurs, you’ll need to exit your short position at a loss.
Double top strategy FAQs
What does a double top mean in forex?
A double top in forex is a technical analysis pattern that occurs when the price of an asset reaches a high point twice. It often means the currency pair's price might start going down after an uptrend. Traders watch for this pattern as a signal that the upward movement could be reversing, and they might consider selling.
What's triple top in forex?
A triple top in forex is a technical analysis pattern where the price of a currency pair reaches the same high level three times, but fails to move higher each time. This pattern can signal a potential trend reversal from an uptrend to a downtrend. Traders watch for a triple top as a sign that the buyers are struggling to push the price higher, and it could be a signal to consider selling the currency pair.
What is double bottom in forex?
A double bottom in forex is a technical analysis pattern that indicates a potential trend reversal from a downtrend to an uptrend. It forms when the price of a currency pair reaches a low point (support level), bounces back up, then returns to a similar low point before bouncing up again. The pattern resembles the letter "W" on the price chart.
Is double top bullish or Is double top bearish?
A double top pattern is typically considered bearish. It is often seen as a reversal pattern signaling a potential shift from an uptrend to a downtrend. The pattern forms when the price reaches a high point twice (forming two peaks) but fails to break above the previous high.