Ever wondered how successful Wall Street traders make money? How they forecast where the price of a stock or currency pair will go? Well, worry no more. In this article, part of our series on technical analysis, we will look at the leading technical indicators or Wall Street indicators that the most successful traders use.
What Are Technical Indicators?
Technical indicators are mathematical calculations or statistical tools used by traders and analysts in the financial markets to interpret price movements and forecast future price trends of assets such as stocks, currencies, commodities, and cryptocurrencies.
There are several factors that contribute to the movement of stocks or other financial assets. For example, financial assets are known to move when there is a major economic release such as inflation, earnings, and consumer confidence data. In the market, this is known as fundamental analysis. Traders who are focused on using this information are known as fundamental traders.
At the same time, the participants in the financial market are human beings. This means that they are usually guided by greed, fear, and other emotions. As a result, they use various methods of trading to find market opportunities. These methods, which have been created using mathematical formulas, are known as technical indicators.
When using technical indicators, it is advisable not to use an indicator in isolation or use very many indicators at the same time. Use only a few top technical indicators that will help you achieve your goal. You must also implement your rules of trading and never lose sight of your trading plan. To understand technical indicators better, you can use a demo account.
Which Indicators are Best for Trading?
- The most popular technical indicators that day traders use include Moving Averages, Bollinger Bands, Relative Strength Index, MACD and Stochastic Oscillator.
- Technical traders use top technical indicators, patterns and oscillators to generate signals. These signals help them predict whether prices will rise or fall.
- Technical traders consider price history, trade volume in combination with other techniques and strategies for technical analysis.
Types of Technical Indicators
Broadly, there are four types of trading indicators.
- Trend indicators are used to tell you the direction an asset is moving in. These include the most popular trading indicators such as moving averages, Ichimoku Kinko Hyo, and MACD.
- Momentum Indicators. These are used to measure or show the strength of a trend. They can be useful in forecasting when a reversal will happen.
- Volume indicators. These tell you how volume of financial assets is changing over time. The volume indicators are used to show you the strength of a trend. Examples of these are On-balance volume and money flow index.
- Volatility indicators. These indicators tell you how volatile the financial assets are at a particular time. These indicators include Bollinger Bands and Average True Range (ATR).
The Best Technical Indicators for Day Trading
If you are just starting day trading, know you are asking yourself, what are the best technical indicators for day trading? Technical traders are important to traders since it gives them an insight into the supply and the demand for securities. Technical indicators help the traders with technical analysis that can help traders predict whether prices will rise or fall.
If you are a novice in trading, you need to choose the best technical indicators for trading. Otherwise, there are many predators waiting to pick your money any time you trade. You must learn how to interpret trends and types of opportunities you can take advantage of. The following is the best technical indicators list.
Moving Averages
If you watch financial media regularly, you have certainly heard the commentators talk about moving averages. It is without a doubt the most common technical indicator out there. Moving averages are the best indicators for index trading. It is also used as a foundation for other types of indicators like Bollinger Bands and MACD. There are four main types of moving averages, which are weighted MA, exponential MA, simple MA, and smoothed MA. However, we recommend that you use Exponential moving average (EMA) because it tends to react faster to the movements.
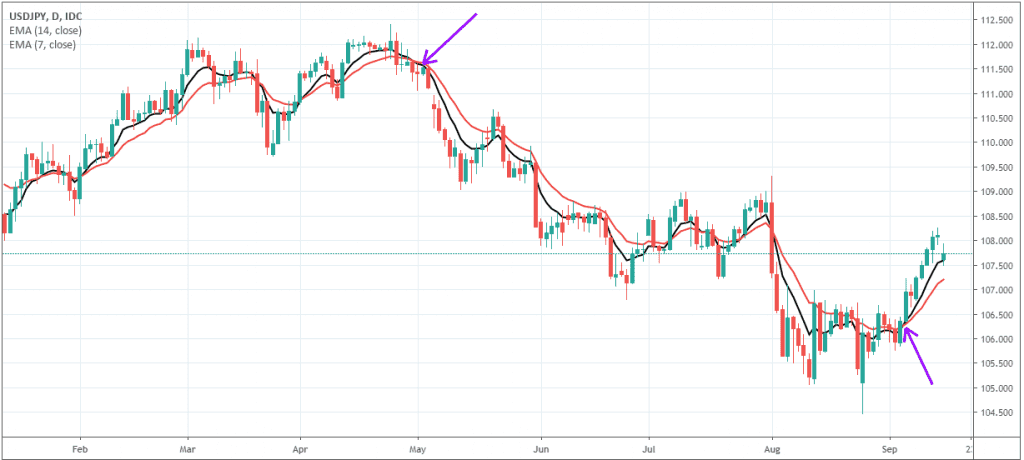
While traders use various strategies when trading moving averages, a common approach that we recommend is that of combining two averages. In this, you add a longer-term moving average and a shorter-term one, as shown on the chart below. On this USD/JPY pair, the 14-day and 7-day EMAs were placed. Short trades were then placed when the 14-day EMA made a cross-over, while buy trades were initiated when the 7-day EMA crossed-over the 14-day EMA.
Tips for Using Moving Averages
- Only use moving averages when the markets are trending.
- Test various periods to see one that shows better guidance.
- Combine moving averages with other indicators.
Read further for what we believe are the five best technical indicators for stock trading.
Bollinger Bands
Bollinger Bands is a popular technical indicator that was developed by a technician known as John Bollinger. The indicator is a volatility indicator that has three lines. The middle line is usually the simple moving average, while the upper and lower bands are the standard deviations. When there is very narrow bands, it is usually an indication that the market activity is relatively quiet. If there are very wide bands, it indicates that there is a lot of volatility in the market.
In case the market is ranging, you should look for the so-called Bollinger Bounce. This is the price in which the price tends to bounce from one side to another. If this happens, you should short when the price hits the higher band and go long when it hits the lower band.
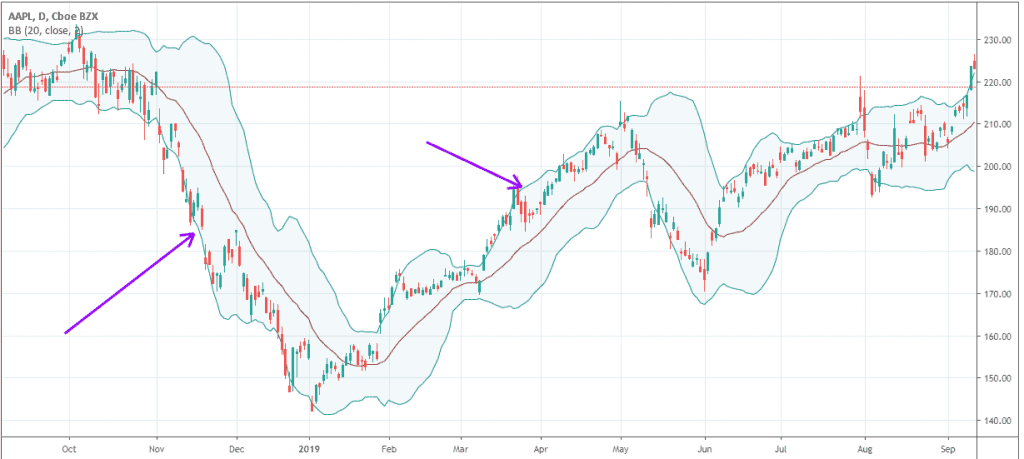
When the market is trending, you should use the so-called Bollinger Squeeze. When this happens, the bands tend to get very close to one another, which is an indication that a breakout will happen. If the candles breakout above the upper band, it is an indication that the price will move upwards. Another approach when there is a strong downward trend is to short, provided the price is trading along with the lower band. A good example of this is shown below.
Relative Strength Index (RSI)
Once again, if you are a regular watcher of the major financial media, you have likely heard them talk about the Relative Strength Index (RSI). The RSI is an oscillator that was developed by Welles Wilder. The indicator usually oscillates between zero and 100. RSI is calculated by finding the Relative Strength, Average Gain, and Average Loss. When applied in a chart, traders focus on three key levels. When the indicator reaches 30 and continues to move lower, it is said to be oversold. When it reaches 70 and continues to move higher, it is said to be overbought. When it is moving horizontally at around 50, it is said to be neutral. A good example of this is shown on the chart below.
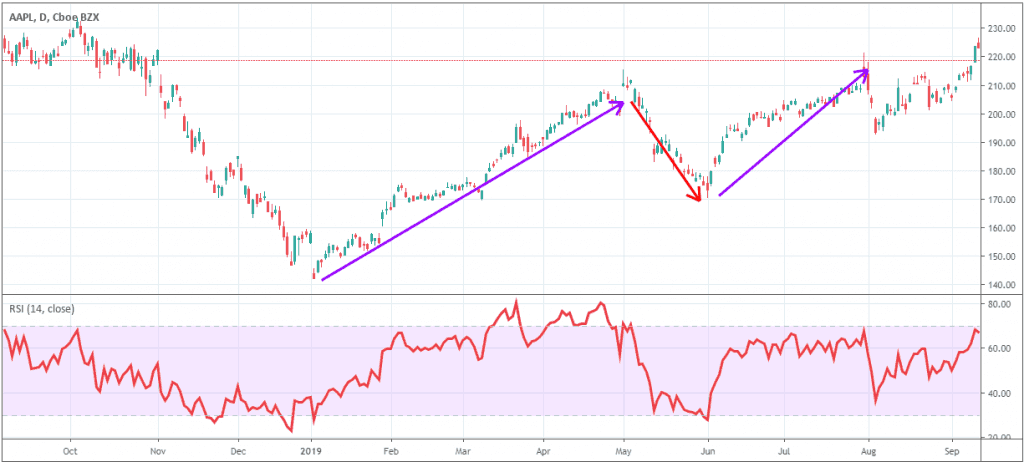
While this concept works well, it is important to be cautious. As you can see in the chart above, there are times when the indicator moves below 30, but the downward trend continues. This means that caution should be made when using the indicator.
Moving Average Convergence Divergence (MACD)
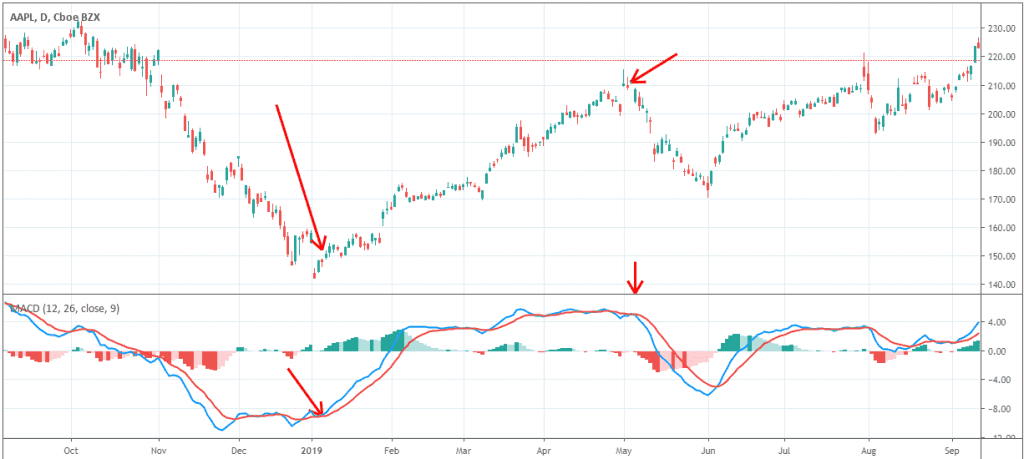
The Moving Average Convergence Divergence (MACD) is another popular indicator you can use today. The indicator turns two moving averages into a momentum oscillator. It does this by subtracting the longer MA to the shorter MA. The indicator usually fluctuates above and below the zero line. While traders use various approaches to trade the MACD, the most popular one is to look at the crossovers of the fast- and slow-moving averages. When the signal line crosses the MACD line, it is usually said to be a bullish signal. Similarly, when the signal line crosses the MACD, it is usually said to be a bearish signal. A good example of this is on the Apple chart below.
Stochastic Oscillator
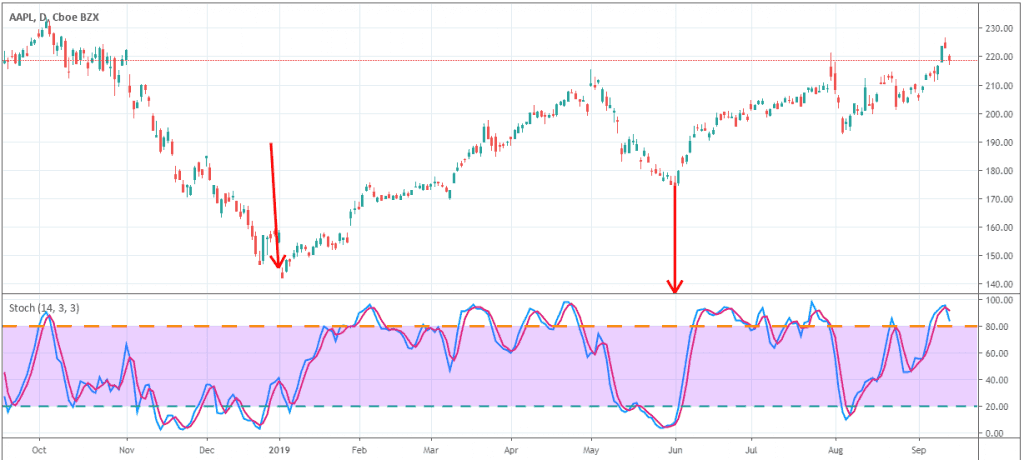
This indicator was developed by George Lane in the 1950s. The indicator is used to show the location of the close relative to the high-low range of an asset. Unlike other indicators, this one does not follow the price and the volume. Instead, it follows the speed of the price. The easiest method of using the stochastic oscillator is to identify areas where the %K and %D lines make a crossover when they are in the upper and lower bands. When the two lines are below the lower band of 20, and they make a crossover, it is usually said to be a good time to buy. When the two make a crossover when they are above the 80 level, it is usually said to be a good place to short. A good example of this is shown in the chart below.
Aroon Indicator
Aroon Indicator is a technical indicator that shows the trend changes and the trade strength of financial assets. Essentially, it measures the time between highs and lows for a certain period of time. You can also use the indicator to know when the new trend is set to begin.
Aroon indicator usually contains an “Aroon Up” that shows the strength of an uptrend, while “Aroon down” measures the strength of a downtrend. When the Aroon Up crosses 100 and stays around that level and the Aroon down stays near zero, it indicates there is an uptrend. If the reverse happens, it is an indication of a downtrend.
Technical Indicators for Trading Success
The above are the best technical indicators for stocks, indices market, and other financial assets. As you can see, this technical indicators list can be a useful tool to determine the entry point of trade. These tools are also essential when designing your own trading algorithms. Still, these tools don’t do too well on their own. They work perfectly when they are combined with fundamental analysis. It is also recommended to combine a few most successful technical indicators before you enter a trade.
Technical indicators can be a valuable tool for traders, but it is important to remember that they are not perfect. They should not be used in isolation, but rather in conjunction with other forms of analysis, such as fundamental analysis. It is also important to combine multiple technical indicators to get a more complete picture of the market.
More Information
Technical Indicators FAQs
What are technical indicators?
Technical indicators are mathematical calculations or statistical tools used by traders and analysts in the financial markets to interpret price movements and forecast future price trends of assets such as stocks, currencies, commodities, and cryptocurrencies. They help traders make informed decision about buying and selling by providing additional information beyond just the raw price data.
How do I use technical indicators in stock market?
Technical indicators are tools that use historical price data to help investors identify things like a security's trend and potential entry and exit signals. Using technical indicators in the stock market involves selecting specific tools like moving averages or RSI that align with your strategy. These indicators are applied to price charts to provide insights on trends, momentum, and potential reversals.
What are the best technical indicators for day trading?
Selecting technical indicators for day trading depends on your trading style and prevailing market conditions. Some of the most popular include: Moving Averages, RSI, MACD, Bollinger Bands, Stochastic Oscillator, Volume Indicators, ATR, and Fibonacci Retracements.
Do technical indicators work?
Technical indicators can provide insights into market trends and potential price movements, but they are not always accurate. They can be subjective, lagging, and their success depends on market conditions. Some indicators are more accurate than others, but none of them are perfect.
Technical indicators are only one part of technical analysis. Traders often use a combination of indicators and other analysis methods.
How many technical indicators are there?
There are potentially hundreds of technical indicators that traders and analysts use to analyze financial markets.